Execution performance of NAS NBP 3.3
Results obtained on May, 2015.
The NAS Parallel Benchmarks (NPB) are a well-known suite of performance benchmarks to estimate possibilities of HPC systems. They were developed in NASA Numerical Aerodynamic Simulation Program and supported in NASA Advanced Supercomputing (NAS) Division. The following tests from NAS Parallel Benchmarks had been parallelized using Fortran-DVMH high-level language:
- MG (MultiGrid) – Approximation of the solution for a three-dimensional discrete Poisson equation using the V-cycle multigrid method.
- CG (Conjugate Gradiant) – Approximation to the smallest eigenvalue of a large sparse symmetric positive-definite matrix using the inverse iteration method together with the conjugate gradient method as a subroutine for solving systems of linear equations.
- FT (Fast Fourier Transform) – Solution of three-dimensional partial differential equation (PDE) using the fast Fourier transform (FFT).
- EP (Embarrassingly Parallel) – Generation of independent Gaussian random variates using the Marsaglia polar method.
- BT (Block Tridiagonal), SP (Scalar Pentadiagonal) and LU (Lower-Upper) – Solution of a synthetic system of nonlinear PDEs (three-dimensional system of Navier-Stokes equations for compressible fluid or gas) using three different algorithms: block three-diagonal scheme with the method of alternating directions (BT), the scalar pentadiagonal scheme (SP) and method of symmetric successive over-relaxation (algorithm SSOR of LU).
For each problem there is a set of input data. The set is determined by the class of the test. In total, there are 7 classes: S and W classes determine very small input data and are used primarily for testing and debugging during development; A, B and C classes determine small, medium and large data respectively, that designed to test a single node; D and E classes determine very large and huge data, designed to test several nodes.
There are no data dependencies in the loops of MG, CG, FT and EP tests. But the loops of LU, BT and SP tests have regular data dependencies due to using the method of alternating drections in SP, BT and successive over relaxation method in LU.
Table 1 shows the execution times of implemented tests and the diagrams demonstrating acceleration of the tests are shown below.
- Serial versions of the original tests executed on a one core of processor Intel Xeon E5 1660 v2.
- Parallel versions of the tests written in Fortran-DVMH language, executed on the following graphics accelerators: NVIDIA Tesla C2050 with enabled ECC (Fermi generation), NVIDIA GTX Titan (Kepler generation), NVIDIA Tesla k20 with ECC enabled (Kepler generation).
- Parallel versions of the tests written in Fortran-DVMH language, executed on 6-cores processor Intel Xeon E5 1660 v2 with active Hyper Threading (2 threads per core) and disabled Turbo Boost and on 60-cores Intel Xeon Phi 5110 with active Hyper Threading (4 threads per core).
Serial versions of the programs were compiled by Intel Fortran Compiler V15.0 with options -O3 -mcmodel=medium -shared-intel. To compile Fortran-DVMH programs following compilers had been used:
- Intel Fortran Compiler V15.0 with options -O3 -no-scalar-rep -qopenmp;
- C/C++ Compiler V15.0 with options -O3 -no-scalar-rep -qopenmp;
- NVidia Compiler V6.5 with options -arch=sm_35 -O3 -DCUDA_NO_SM_20_INTRINSICS.
Table 1. Execution times of NAS NPB 3.3
| Тests | Fortran | Fortran-DVMH | |||||
|---|---|---|---|---|---|---|---|
| Intel Xeon E5 | NVIDIA Tesla C2050 (enabled ECC) |
NVIDIA GTX Titan (disabled ECC) |
NVIDIA Tesla k20 (enabled ECC) |
Intel Xeon E5 | Intel Xeon Phi 5110 | ||
| BT | A | 40,7 | 9,61 | 2,71 | 2,78 | 6,97 | 7,68 |
| B | 166,9 | 46 | 8,67 | 8,31 | 28,8 | 20,9 | |
| C | 713,3 | 142,7 | 28,9 | 28,15 | 118,1 | 74 | |
| SP | A | 28,6 | 7,4 | 2,25 | 3,25 | 6,75 | 11,6 |
| B | 116,9 | 26,12 | 9,65 | 13,34 | 29,18 | 27 | |
| C | 483,24 | 92,6 | 29,74 | 45,9 | 122,2 | 120 | |
| LU | A | 35,07 | 7,15 | 4,76 | 4,74 | 4,7 | 16,5 |
| B | 148,5 | 20,4 | 11,84 | 10,09 | 33,7 | 57,7 | |
| C | 852,3 | 61,5 | 33,73 | 29,91 | 99 | 157,3 | |
| EP | A | 16,7 | 0,28 | 0,41 | 0,17 | 1,5 | 0,78 |
| B | 67,33 | 0,71 | 1,02 | 0,27 | 5,99 | 2,99 | |
| C | 266,3 | 2,6 | 3,9 | 1,13 | 23,96 | 11,6 | |
| MG | A | 1,06 | 0,46 | 0,19 | 0,38 | 0,38 | 0,61 |
| B | 4,96 | 2,17 | 0,87 | 1,86 | 2,14 | 2,8 | |
| C | 42,3 | 8,33 | 3,89 | 5,78 | 16,2 | 15,5 | |
| CG | A | 0,94 | 2,14 | 0,56 | 1,42 | 0,31 | 1,41 |
| B | 78,8 | 71,7 | 19,2 | 35,22 | 15,3 | 21,18 | |
| C | 221 | 221,7 | 59,16 | 102,9 | 40,8 | 64,6 | |
| FT | A | 3,05 | 0,75 | 0,31 | 0,47 | 0,45 | 0,64 |
| B | 39,5 | 10,7 | 3,9 | 6,63 | 6,38 | 8,46 | |
| C | 199,3 | 50,8 | 18,4 | 31,42 | 25,7 | 46,6 | |
The diagrams demonstrating acceleration of NAS NPB 3.3
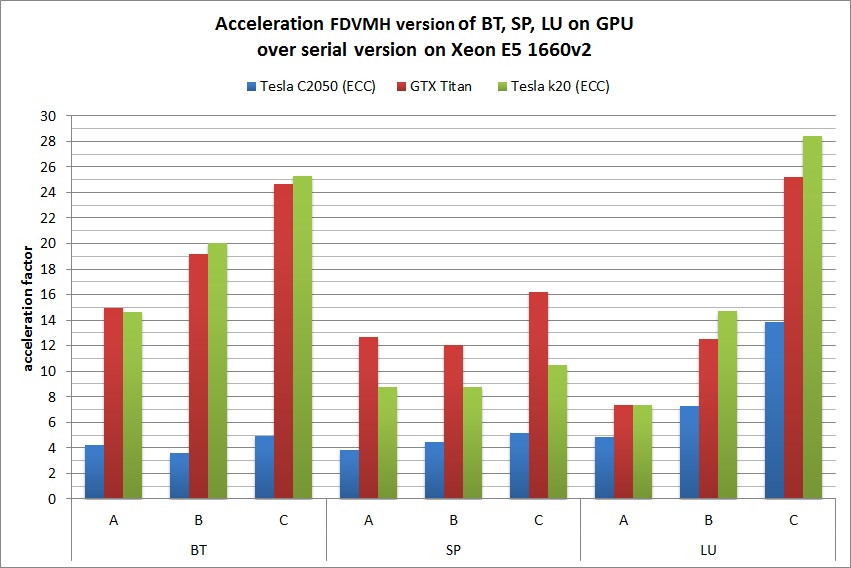
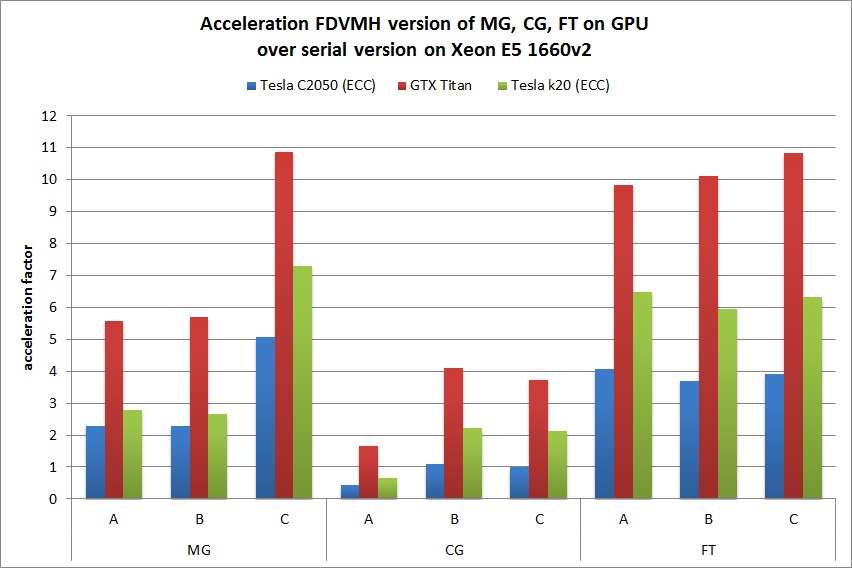
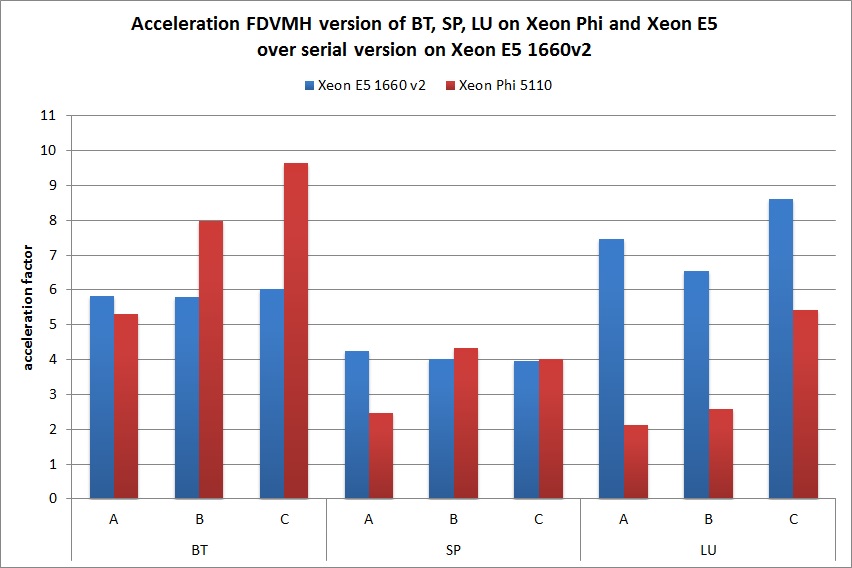
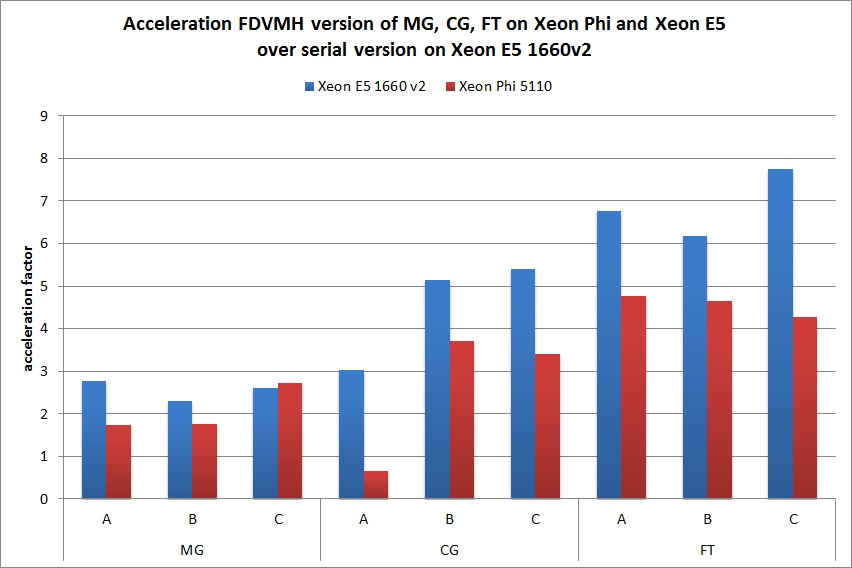
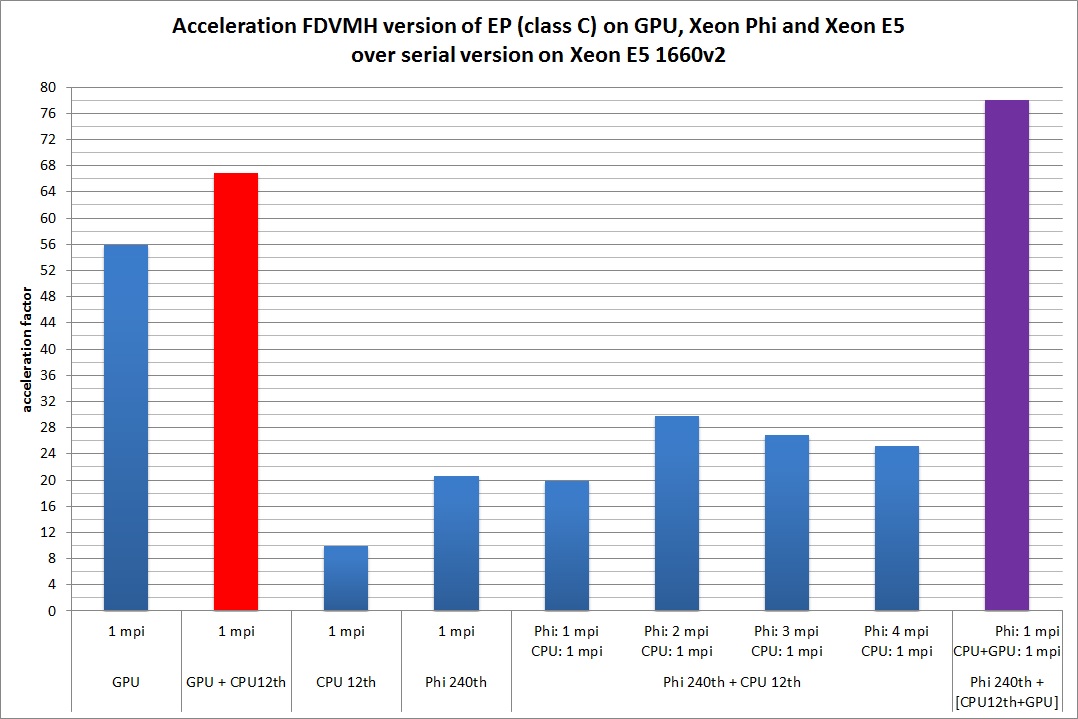
Fig. 5 shows the acceleration of EP test on class C compared to a sequential version of the program executed on a single core of Intel Xeon E5 1660 v2. This test was executed on different architectures separately as well as in the following combinations: Intel Xeon E5 1660 v2 + GTX Titan, Intel Xeon E5 1660 v2 + Intel Xeon Phi and Intel Xeon E5 1660 v2 + GTX Titan + Intel Xeon Phi. For each configuration the number of MPI-processes and the number of OpenMP-threads within each of the MPI-processes are specified. Red and purple colors show cases when load balancing was additionally used by setting the ratio of the weights of all cores of CPU and GPU, and ratio of weights of MPI-processes mapped on the CPU and coprocessor.
Below the comparison of FDVMH versions of the tests from NAS NBP 3.3 package with the following versions of the programs is presented:
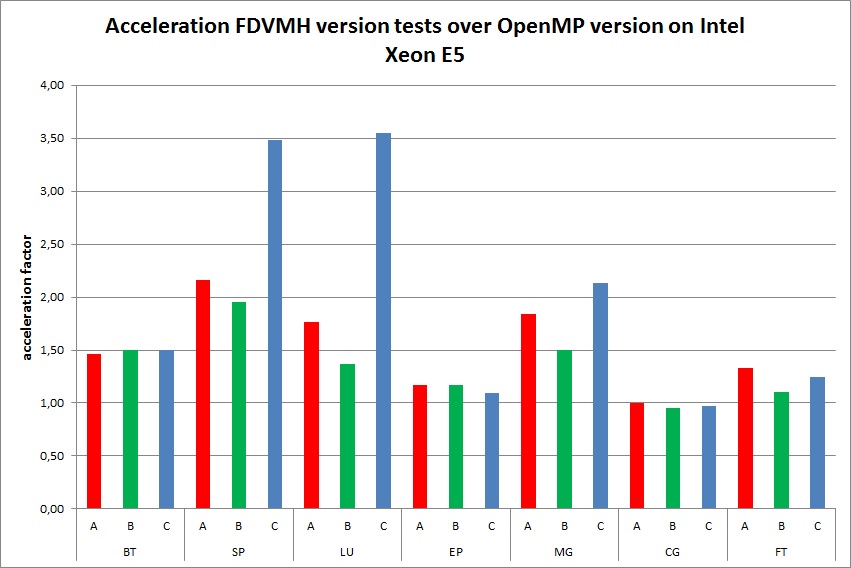
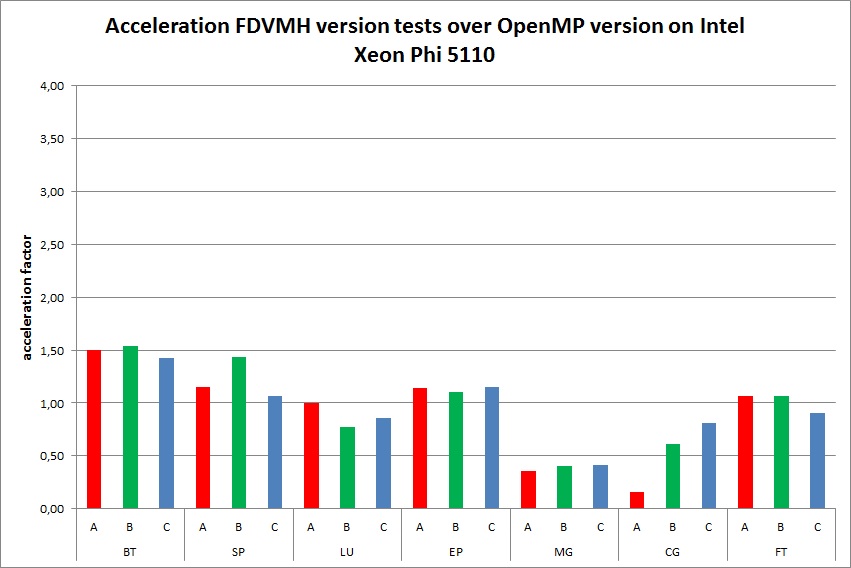
- with source versions of NAS tests parallelized using OpenMP (Fig. 6, Fig. 7);
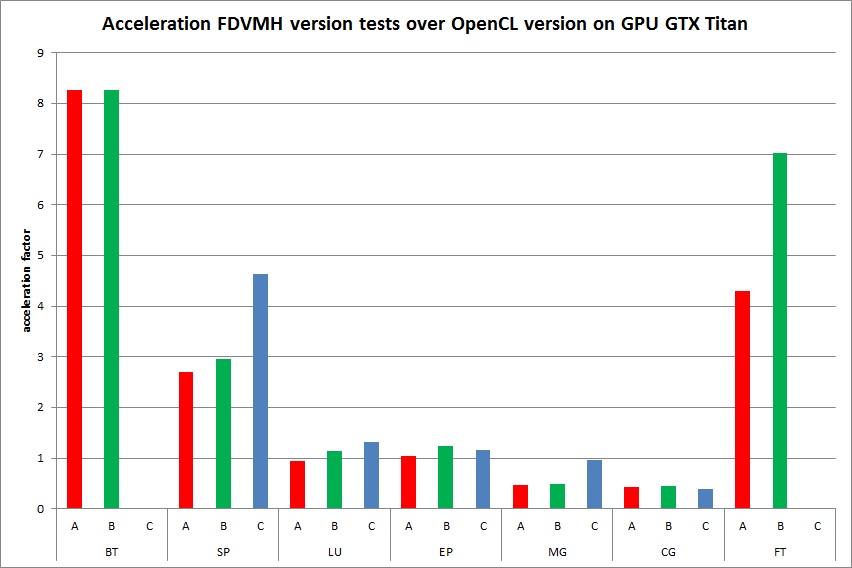
- with C versions of NAS tests parallelized using OpenCL (Fig. 8);
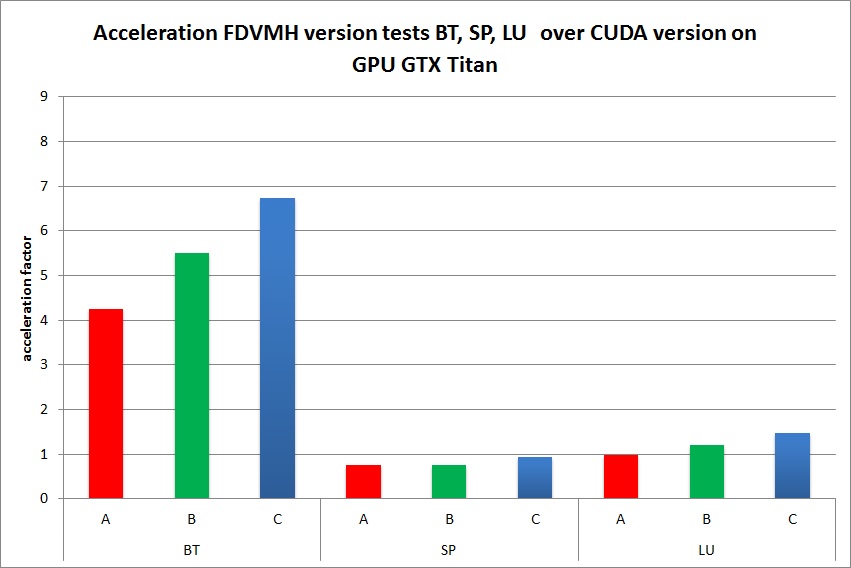
- with C++ versions of NAS tests parallelized using CUDA (only LU, BT, SP tests) (Fig. 9).
For compilation of the programs NVIDIA CUDA Toolkit V6.5, PGI V15.0, Intel Fortran V15.0 were used. In comparison with OpenMP versions of the standard tests executed on CPU, DVMH versions don’t concede on performance, and on some tests (SP, LU) win by 3,5 times. These tests executed on Intel Xeon Phi show approximately the same acceleration, as well as DVMH versions, except MG and CG tests (deceleration approximately twice). In comparison with OpenCL versions executed on GPU GTX Titan, DVMH versions don’t concede on performance on LU and EP tests, are twice slowed down on MG and CG tests, and 6-8 times quicker on BT, SP and FT tests. It is also worth noting that for BT and FT test on class C 6 GB of GPU memory was insufficiently for OpenCL-versions therefore we can’t compare performance on given class.The cause of deceleration on MG and CG tests is that DVMH compiler well parallelizes the programs using regular grids. But in MG test the grids of different sizes are used, and in CG – the rarefied matrixes. Starts of OpenCL programs on CPU and Xeon Phi showed very bad results therefore they aren’t presented in this section. In comparison with CUDA versions executed on GPU GTX Titan, DVMH versions don’t concede on performance on LU and SP tests, and are 4-7 times quicker on BT test.